Mapping Macroeconomics
An interactive platform for the exploration of inter-specialties relationships in macroeconomics 1970 - 2020
This project has received a grant from the History of Economics Sociey New Initiatives Fund. I am collaborating with Alexandre Truc, who is working with me on the data analysis part, and with Pedro Garcia Duarte who plays the role of advisor on the interpretations and presentations of our results.
Table des matières
Objective
It takes as a point of departure that economics has been characterized since the 1970s by an exponential increase in the number of articles published in academic journals. This phenomenon makes it harder for historians of economics to properly assess the trends in the transformation of economics, the main topics researched, the most influential authors and ideas, etc. As a result, historians of this period run the risk of relying, at least as first pass, on a presentist view of the history of ideas: what today’s economists consider as important contributions from the past and the most influential authors. When historians shield themselves from the retrospective views of the practising economists, they have to delve into the literature of the past that has been forgotten for the most part and to scrutinize the network of authors that are little known. This effort allows historians to correct the potted histories of the practising economists and to propose alternative narratives of the evolution of the discipline.1 However, the bigger the literature to be studied is, the harder the historians’ capacity to grasp the overall picture of the time.
We agree with those who consider that developing collective quantitative tools could help historians to confront this challenge. The issues and uses of quantitative tools in history of economics have been the topic of many discussions in our field—see for instance Backhouse (1998), Claveau and Gingras (2016) and the Journal of Economic Methodology special issue in 2018, in particular Edwards, Giraud, and Schinckus (2018) and Cherrier and Svorenčík (2018)—, but the technical barrier posed by the methods remains an obstacle for many historians. The challenges and opportunities that a quantitative history brings are particularly useful to the recent history of macroeconomics. Practising macroeconomists are eager to tell narratives of the evolution of their field that serve the purpose of intervening on current debates, by giving credit to particular authors and weight to specific ideas. Historians who go into this area find plenty of accounts by macroeconomists and have to handle the vast increase in the macroeconomic literature since the last quarter of the past century.
Our goal is to build an online interactive platform displaying bibliometric data on a large set of macroeconomic articles. We aim at settling the basis for a broad and long-run project on the history of macroeconomics, as well as to bring to historians tools to run quantitative inquiries to support their own research work.
Our approach is similar to Claveau and Gingras (2016) as we focus on the same bibliometric data and share many common tools.2 It differs from and extends it in several ways as our platform will:
- Focus on a smaller part of economics (i.e. macroeconomics) to keep a better control on the results and their interpretation, using the knowledge we have on the history of macroeconomics. In contrast, Claveau and Gingras (2016) offer a broad history of the many specialties in economics since the late 1950s.
- Offer interactions between micro- and macro- levels of analysis, by following the positioning (and the evolution over time of this positioning) of some authors, articles or institutions within the general map brought by network analysis. This would be possible by displaying less aggregated visualisations than Claveau and Gingras (2016).
The goal of our platform is to bring forward general visualizations of the structure of macroeconomics between 1970 and 2020 to:
- Introduce bibliometric and network analysis tools, concepts and results to non-specialists in history of economics;
- Present general results about the structure of macroeconomics:
- Importance and centrality of particular actors, articles and books, or institutions;
- Evolution of topics, ideas and subspecialties. For instance, it would allow us to explore the supposed opposition between “fresh water” and “salt water” macroeconomists (Gordon 1989) or the rise of the “New Neoclassical Synthesis” (Goodfriend and King 1997).
- Allow historians (but also macroeconomists) to explore questions of interests for their research:
- Identify relevant bibliographical documents and actors for a particular object in a simple and efficient way;
- Check simple claims about particular facts in macroeconomics (e.g., most cited papers by macroeconomists in a given time frame, or the role and importance of particular actors and contributions, searchable on the platform);
- Find new research directions in relation to under-studied topics or new unexplored patterns found in the data.
Metholodogy
The first stage of the project is to find a set of articles that properly identifies macroeconomics. In the initial work already done in this project, we have pondered this challenge and one solution is to identify macroeconomic articles from JEL codes. Our procedure led us to develop two different corpora. The first corpus is simply made of all articles identified as macroeconomics by both the old (1969-1990) and new (1991-present) JEL codes system. This corpus is useful to understand how economists classify their own research into categories.
We have also developed a second corpus, less dependent on the economists’ classifications, to identify what composed macroeconomics from a sociological and intellectual perspective. The second corpus uses this first corpus as a point of departure to identify all the articles closely related to macroeconomics with a two steps procedure that we apply to the old and new JEL codes corpus: (1) identify the core of macroeconomics by isolating the most cited references; (2) extending the core by identifying the articles citing several articles of the core or cited by several articles of the core.
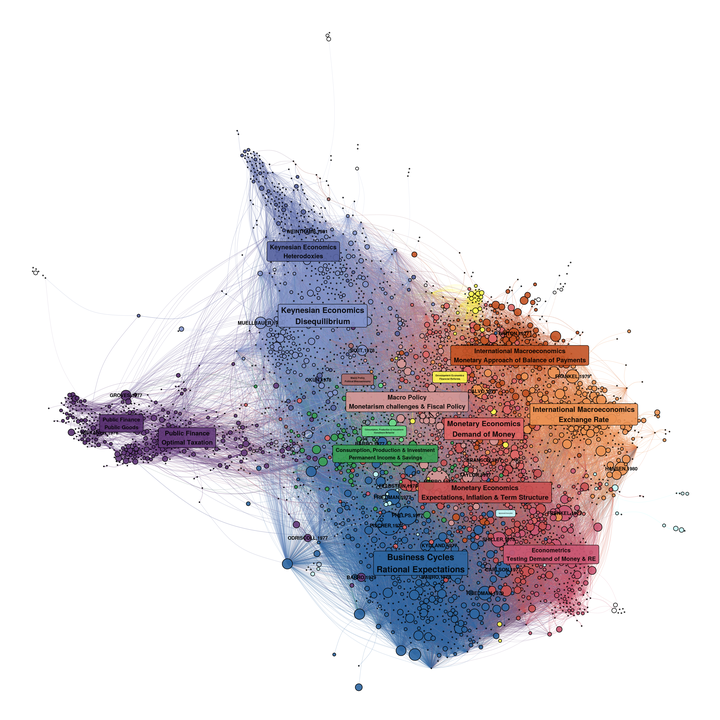
Our analysis of this corpus will heavily rely on network analysis, and particularly on bibliographic coupling networks, which links articles depending on the number of references they share in their bibliography. We will then use the Leiden algorithm (Traag, Waltman, and van Eck 2019) to identify communities in this type of networks, for different period. An important step will be to characterize qualitatively this community to understand what they represent. It would also allow us to explore the role of different academic journals and institutions in macroeconomics (which are the main journals over time, how institutions specialised in sub-specialties of macroeconomics and how they structured the field, etc.).
The online platform we want to create would allow the user to explore our data and visualizations. First, the user would be able to navigate in our networks, by zooming and clicking on the nodes to identify them, but also to identify in the network the articles, authors or institutions she is interested in thanks to a search engine. Second, the user would be able to select the period she is interested in, and to generate the corresponding networks, but also citation statistics depending on the dates chosen.
Tools
The repository of the project with our R scripts is on github .
The data analysis (extracting the corpus, building networks and analysing them) part is done with R. With Alexandre Truc, we are currently developping two R packages to support this project: biblionetwork and networkflow. The second one heavily relies on igraph (Csardi and Nepusz 2006), tidygraph (Pedersen 2020b) and ggraph (Pedersen 2020a) great packages.
The interactive platform will be built by resorting to the Sigma javascript library, which is also used for the software GEPHI.
References
Backhouse, Roger E. 1998. “The Transformation of U.S. Economics, 1920-1960, Viewed Through a Survey of Journal Articles.” History of Political Economy 30 (4): 85–107. http://search.ebscohost.com/login.aspx?direct=true&db=bth&AN=7752166&lang=fr&site=ehost-live.
Cherrier, Beatrice, and Andrej Svorenčík. 2018. “The Quantitative Turn in the History of Economics: Promises, Perils and Challenges.” Journal of Economic Methodology 0 (0): 1–11. https://doi.org/10.1080/1350178X.2018.1529217.
Claveau, François, and Yves Gingras. 2016. “Macrodynamics of Economics: A Bibliometric History.” History of Political Economy 48 (4): 551–92. https://read.dukeupress.edu/hope/article-abstract/48/4/551/12684/Macrodynamics-of-Economics-A-Bibliometric-History.
Csardi, Gabor, and Tamas Nepusz. 2006. “The Igraph Software Package for Complex Network Research.” InterJournal Complex Systems: 1695. https://igraph.org.
Düppe, Till, and E. Roy Weintraub. 2014. Finding Equilibrium: Arrow, Debreu, McKenzie and the Problem of Scientific Credit. Princeton: Princeton University Press.
Edwards, José, Yann Giraud, and Christophe Schinckus. 2018. “A Quantitative Turn in the Historiography of Economics?” Journal of Economic Methodology 25 (4): 283–90. https://doi.org/10.1080/1350178X.2018.1529133.
Forder, James. 2014. Macroeconomics and the Phillips Curve Myth. Oxford: Oxford University Press.
Goodfriend, Marvin, and Robert King. 1997. “The New Neoclassical Synthesis and the Role of Monetary Policy.” In Macroeconomics Annual 1997, edited by NBER, 231–96. Cambridge (MA): MIT Press.
Gordon, Robert J. 1989. “Fresh Water, Salt Water, and Other Macroeconomic Elixirs.” Economic Record 65 (2): 177–84.
Medema, Steven G. 2014. “The Curious Treatment of the Coase Theorem in the Environmental Economics Literature, 1960–1979.” Review of Environmental Economics and Policy 8 (1): 39–57.
Pedersen, Thomas Lin. 2020a. Ggraph: An Implementation of Grammar of Graphics for Graphs and Networks. https://CRAN.R-project.org/package=ggraph.
———. 2020b. Tidygraph: A Tidy API for Graph Manipulation. https://CRAN.R-project.org/package=tidygraph.
Traag, Vincent A, Ludo Waltman, and Nees Jan van Eck. 2019. “From Louvain to Leiden: Guaranteeing Well-Connected Communities.” Scientific Reports 9 (1): 1–12.
Aurélien Goutsmedt
Chercheur Postdoctoral et Chargé de Cours
Je travaille sur l’histoire de l’économie et l’expertise économique.