A Road Map for historians of economics to learn R

Table of Contents
Why learning R?
Debates about the use of quantitative methods when studying the history of economics have flourished in the last years—see for instance the special issue in the Journal of Economic Methodology (Edwards, Giraud, and Schinckus 2018)—and many recent contributions have used bibliometrics, network analysis or topic-modelling.1 When the temptation is growing in you to try your hand at quantitative methods (as it has been the case for me a couple of years ago), the first question is likely to be “but how can I do, and which tools should I learn to use?”
It exists many software (some free, others to buy) that would allow you to use bibliometrics, networks analysis or topic-modelling. Depending on what you want to do, you will have to learn each corresponding software—after being sure that the tool is appropriate to accomplish the task you have in mind. That is what I did when I wanted to use network analysis for one of my paper: I learned how to use the very good GEPHI. However, Gephi is great when you want to manipulate networks, but at the condition that you have already built your network. And if you want to use other types of quantitative analysis on your data (for instance text analysis and topic-modelling), you will need to find another software. That is why, after this first research project integrating quantitative methods, I took another direction: I learned to program in R.2
Obviously, learning R has a higher entry cost than learning GEPHI—2 or 3 hours should be sufficient to learn the basics of the latter. But it offers many advantages and, in the medium- and long-term, large economies of scale:
It would allow you to manipulate more easily and more quickly your data than by using excel (either programmatically or manually). You will be able to do things you cannot do in excel. And this becomes more and more true the larger your dataset.
You will be able to use different quantitative methods (bibliometrics, network analysis, natural language processing, econometrics, machine learning, etc.) and to build visualisations just by learning one unique language (thanks to the many packages implemented in R).
Writing “scripts” in R allows you to re-run the same tasks without any supplementary effort each time your data are changing or you want to change a parameter of your analysis. Besides, these scripts are a resource that you will be able to re-use in other projects.
Outside of quantitative methods strictly speaking, learning R will enable you to do several other things:
- writing books, articles, reports and slides efficiently thanks to Rmarkdown (Allaire et al. 2021);
- publishing online your analyses and building dashboards and applications.3
If you are convinced that programming in R could be useful for you as a historian of economics, you now need some resources to learn to code. Here is a list of useful packages and tutorials I wish I had when I started learning to program in R and which I have used extensively since then to improve my skills.
First step: the basics
The very first step is obviously to download and install R and Rstudio on your computer, and to understand the basics of R language and how to use Rstudio. The first chapter of McConville (2021) or this lesson from R-ladies Sydney are good places to start from.
Once you are a bit familiar with what R is and the functioning of Rstudio, I think the priority is then to become familiar with the tydiverse collection of packages (Wickham 2021a; Wickham et al. 2019). A very reliable guide here is obviously Wickham and Gromelund’s (2017) R for Data Science. In this book, you will learn how to import data, how to transform them, how to visualise them and how to apply statistical models to them.4.
Another useful detour when you have progressively learned the basics of R, is to understand how to organise your workflow with R and Rstudio (how to organise your files? Why and how to create an “RStudio project”?): you can find useful information in the second chapter of Jenny Bryan (2017). I don’t want to overload the boat too soon, but when you will have begun your first project, it could be useful to learn the basis of version control and git. That is something that will be indispensable when you will work collectively on a project in Rstudio. Because using git is not very intuitive and because you will probably tear your hair out at first, it is better to become accustomed to use git from the beginning even (and above all?) when you are working alone. You will be confronted to simple cases and you will be less afraid to use git versioning in collective projects then. Jennyfer Bryan (2019) offers a rich documentation to learn to use git and github—the latter being fundamental to share your code and give explanations on the projects you are working on.5
R offers great tools for building a large variety of visualisations. The package ggplot2 (Wickham et al. 2021; Wickham 2016) is obviously the first of these tools, and you can find a dense documentation here. Kieran Healy’s (2018) book is also a good read to learn ggplot2 while thinking about the best practices to build data visualisations. One of the advantages of the ggplot2 is that it is accompanied by many extensions (new types of visualisations, tools to customize in different ways the visualisations produced with ggplot2, new themes and colour palettes, animation, etc) listed here. I acknowledge that learning this “grammar of graphics” is far from easy at the beginning, for you will have to know many functions and take into account many features when producing quantitative visualisations. The esquisse extension (Meyer and Perrier 2021) could allow you to reduce the cost of entry and to get used to the functions of ggplot2 gradually: it is an Rstudio add-in that allows you to build interactively your visualisations.
If you want to produce dynamic and interactive visualisations, the package plotly (Sievert et al. 2021; Sievert 2020) offers many possibility. The advantage of plotly is that, for some basic features, you can convert the visualisation produced with ggplot2 to interactive visualisations with just one line of code. But plotly for R also allows more complex customisation that necessitate to investigate more in-depth the different functions of the package (see a detailed documentation here).
This is it for the basics: obviously, you won’t master all the packages above in one day, and you will progressively get the hang of them in working on your own research project. However, you will likely need most of them in all the quantitative projects you will start, whether you want to do some simple statistical analysis on a prosopographic database of economists trained at the MIT, a comparison of the words used by Adam Smith and David Ricardo, or a bibliometric analysis of the publications about discrimination in economic academic journals. The following tools I will present you target more specific uses.
Learning bibliometrics and network analysis
Bibliometrics is useful for historians of economics to understand how the discipline has evolved, what are the major influences for specific sub-fields, how different communities have structured the discipline at different periods, etc.6 Network analysis comes as a complement of bibliometrics to produce bibliographic coupling, co-citation, keyword or co-authorship networks.
A first package, bibliometrix, offers different functions from extracting bibliometric data from different platforms (like Web of Science or Scopus), to computing statistics and building networks. I have never used it extensively, for two reasons:
- I was working on large sets of data and bibliometrix appeared a bit slow for that;
- I found the functions a bit like black boxes, and not really compatible with the tidyverse spirit. However, it seems very rich and I am sure it worth exploring.
Once you have your data—which is far from being an easy step7—I have developed, with the help of Alexandre Truc and François Claveau, a package to make the creation of very large networks of bibliographic data easy and fast: biblionetwork (Goutsmedt, Truc, and Claveau 2023). What you need as an input is a corpus and the references cited by this corpus, and you will be able to create easily a list of links between articles, references, authors, institutions, etc., with different measures of weights for these links.
Once you have your edges/links, you can create a network with the help of the igraph package (Csardi and Nepusz 2006). igraph is a very rich package with many functions to calculate network statistics (like centrality measures), find clusters and arrange the nodes in space. However, manipulating networks with igraph is not always very intuitive. Fortunately, the tidygraph package (Pedersen 2020) allows you to transform the networks in “tidy” data, in the tidyverse spirit, and to manipulate the networks accordingly. Similarly, the ggraph package (Pedersen 2021), which is an extension of ggplot2, allows the production of nice network visualisations.
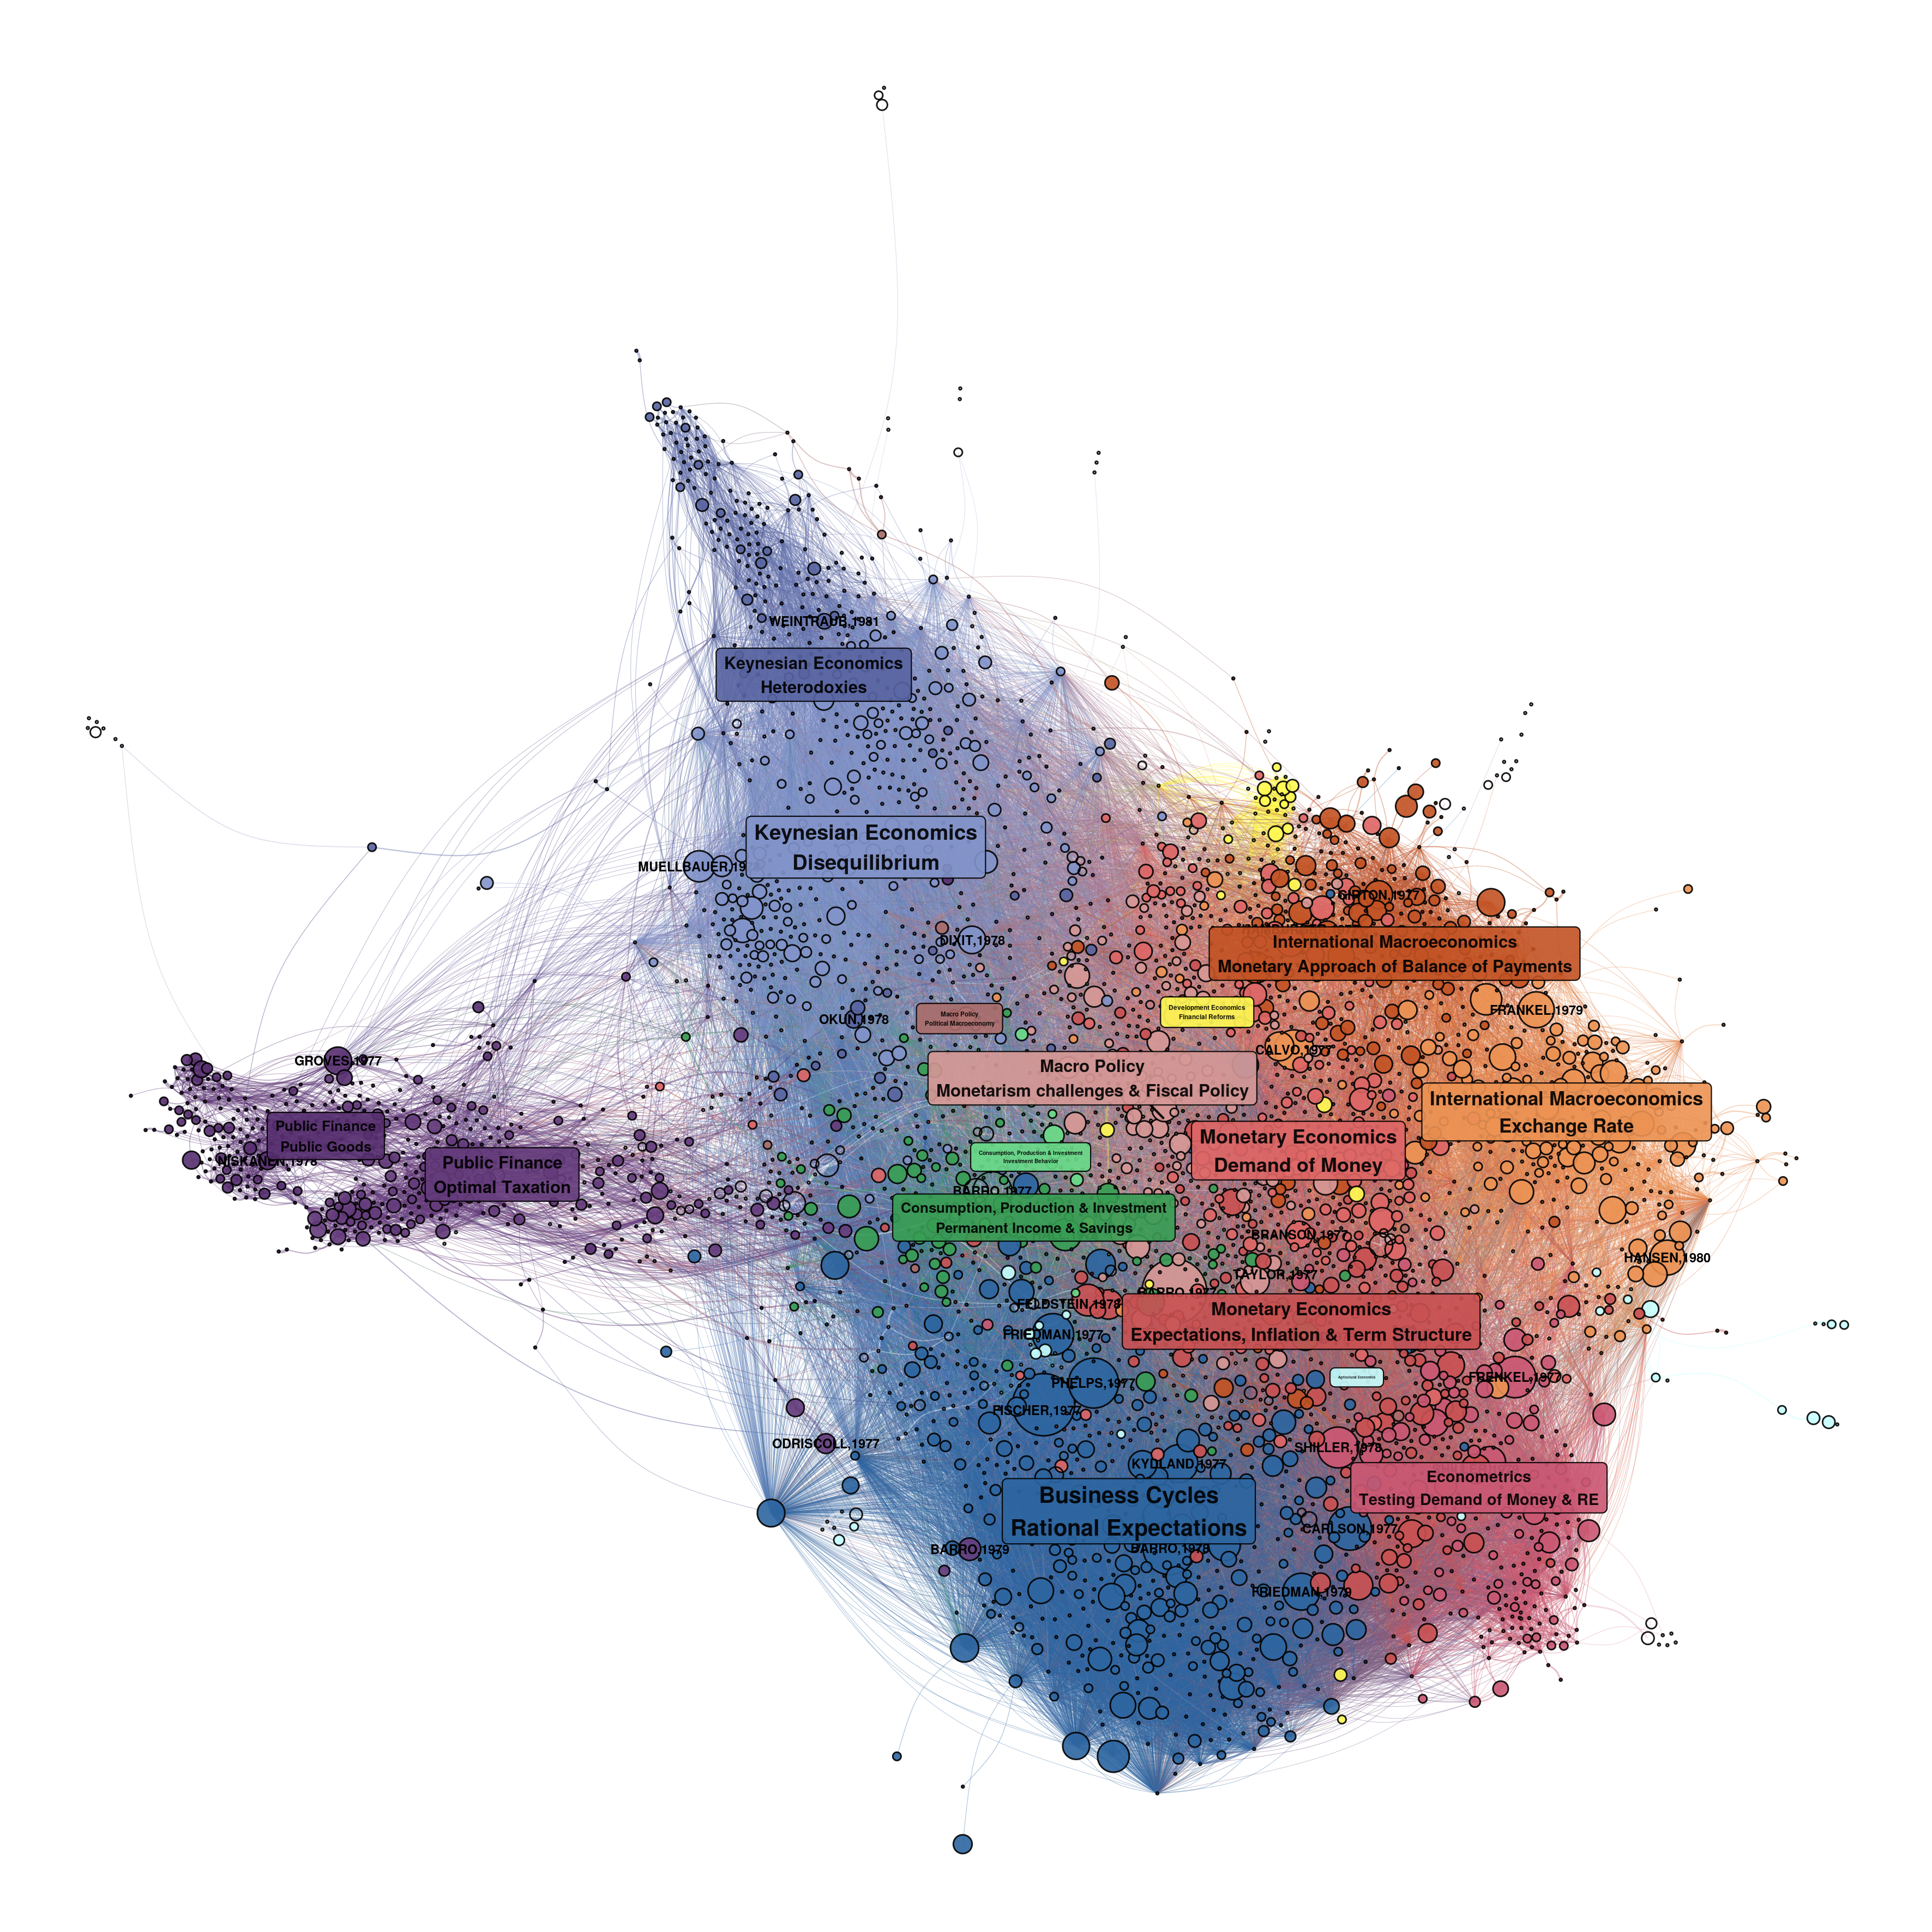
Figure 1: Network example from the Mapping Macroeconomics project
Alexandre Truc and I are currently developing another package, networkflow, to facilitate the manipulation of networks, thanks to tidygraph and ggraph. The goal is to build some routines to mark out and accelerate the analysis of networks, from network creation, through clustering and spatialisation, to visualisation. In a close future, the package will integrate some tools for dynamic network analysis (by comparing the evolution of different networks over time).
Try your hand at text mining and topic modelling
Text mining is an essential approach to analyse large corpus and thus can bring useful information for historians of economics.
The first step is to transform the text of your documents in readable data in R. It first implies that the text of your documents is recognisable. To check that, you can just copy the text of a random page of your corpus and paste it on a text editor. If the text is not recognisable, or if the quality is not good, you should run Optical Character Recognition. In my former projects, I have used a very efficient OCR via a purchased software, PDF Element. I found it better than the tesseract OCR engine. However, I did not push the possibilities of the engine to the end. tesseract has been implemented in R in a package (Ooms 2021b). If you have pdf and that the text recognition is good, you can use the pdftools package (Ooms 2021a) to extract the text and manipulate it with R.
Once you have the text of your corpus ready to be imported in R, you can begin the analysis. Julia Silge and David Robinson (2020) have written a great introductory book to text mining in R. It relies on the tidytext package (Robinson and Silge 2021; Silge and Robinson 2016), which brings simple functions to do complicated things (tokenizing texts, calculating statistics like TF-IDF, etc.). If you want to know more about tokenization, stemming and lemmatization, stop words, or words embeddings, you can move to the next step and read the first part of Supervised Machine Learning for Text Analysis in R (Silge and Hvitfeldt 2021).
Once you have acquired some mastery for extracting text, cleaning and preprocessing it, and calculating standard statistics, you can be interested by more complex techniques and machine learning. Here, topic modelling can offer very rich results. It refers to the use of a model (the Latent Dirichlet Allocation being the most used) to identify k topics (k being determined by the modeller) in your corpus. The result of your topic modelling is that you will have each document of your corpus represented as a mixture of topics, and each topic represented as a mixture of words. To run topic modelling in R, you will find interesting information in Silge and Robinson’s (2020) corresponding chapter. In this chapter, they are using the topicmodels package (Grün and Hornik 2021, 2011).8 But I find that the stm package (Roberts, Stewart, and Tingley 2020) is also very useful with very nice functions implemented in it. It allows you to cross your topic modelling with the meta data of your corpus.
Finally, to help you running topic modelling in R (but also for other text mining issues), you can check the tips and good practices discussed by Welbers, Van Atteveldt, and Benoit (2017) or Banks et al. (2018). More generally, R offers many resources for text mining and Natural Language Processing (NLP): you can find an overview of the different existing packages here.
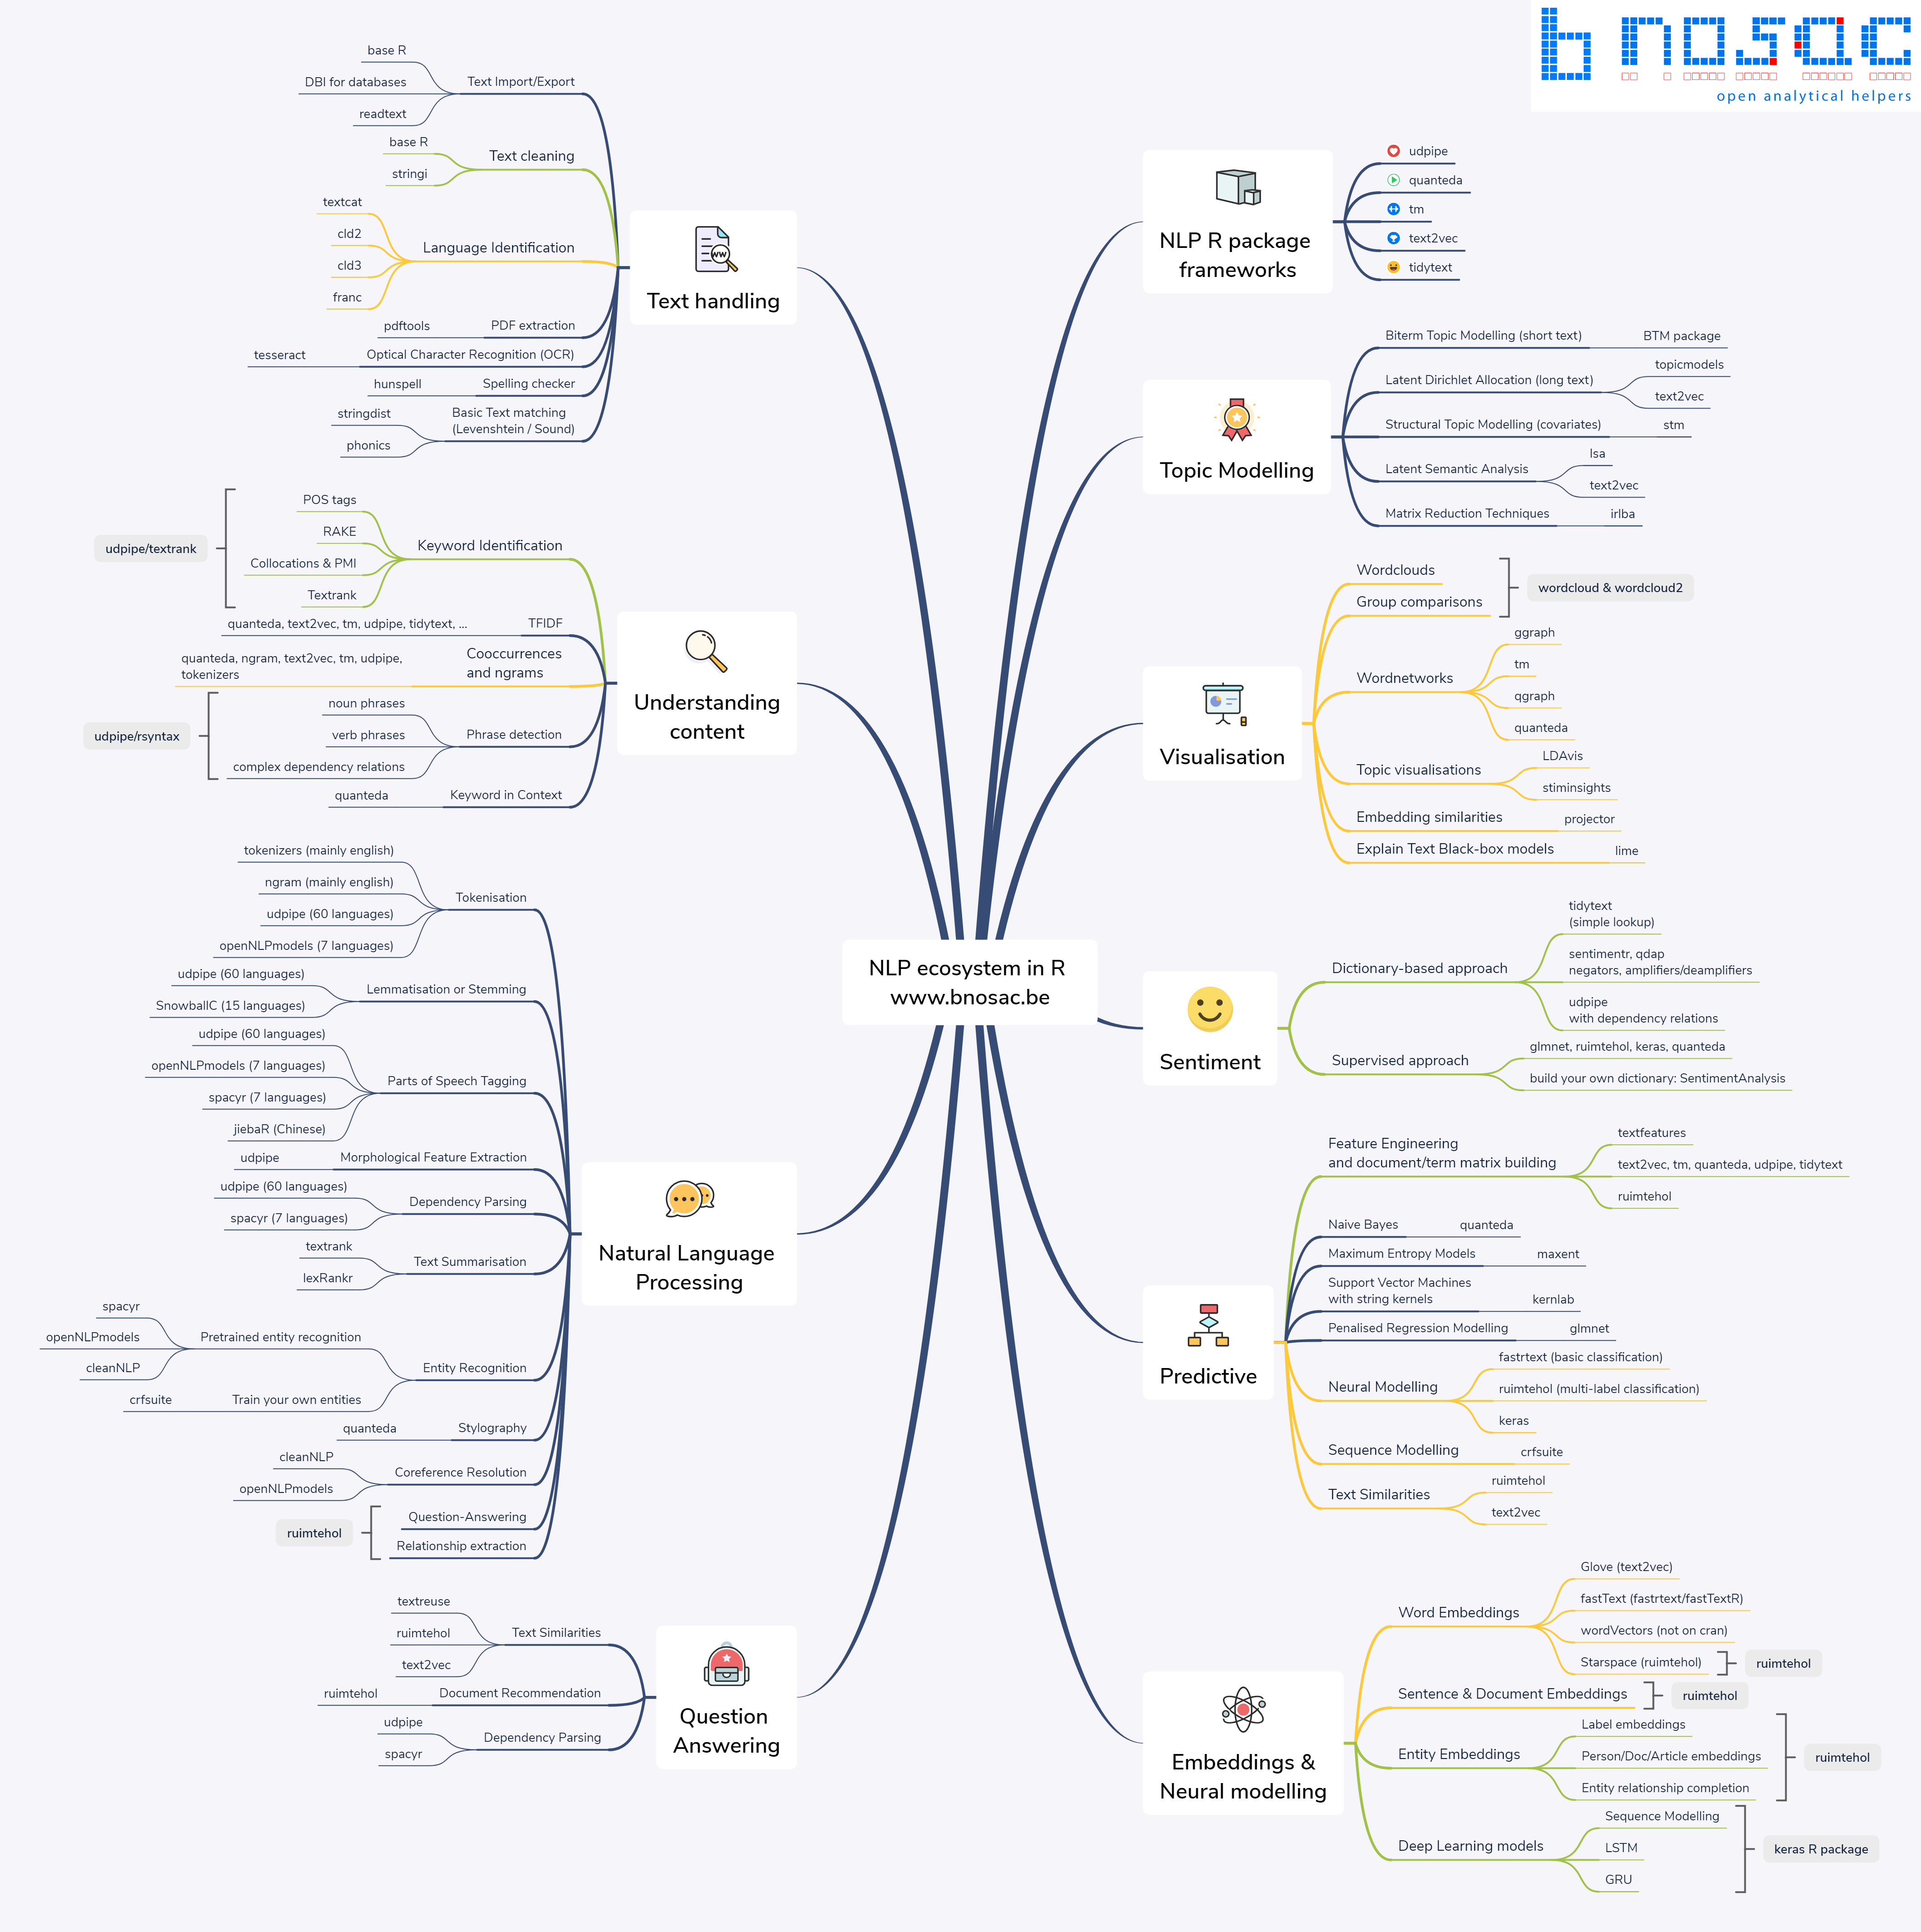
Figure 2: Natural Language Processing ecosystem in R
Digging into modelling and machine learning
I am not a specialist of modelling and machine learning at all, but I hope I will have the occasion to train myself in the next years. Indeed, there are many occasions it can be useful for historians. If you want to refresh your memory in econometrics why learning R, you can look at Schmelzer’s (2021) book that you can read online. Regarding machine learning, which can have numerous applications in history of economics, notably with classification techniques, I found that Greenwell (2020) offers a nice introduction to the implementation in R of different machine learning algorithms—you can read it here.
To help R users in their modelling job, the tidymodels collection of packages can be very useful, whether for preprocessing your data, evaluating your model or tuning your parameters. The website has also many interesting tutorials to learn the tidymodels approach.
Programming further: Functions, functions, functions… and packages
Once you move forward in mastering these different methods and improve your skills in R coding, an important task is to solidify your code and make it reliable for future work. The first step when writing code, is to document it: give your script a clear structure, explain why your are using this function, keep a trace of failed paths, point out what you could improve, etc. This could be useful for collaborators or readers of your scripts, but above all it will be useful for future you, as a messy script is the best way to lose a lot of time two or three months later when you will have to come back to your project (for instance after having received referees’ reports on your paper). You can find some useful advice here about structuring your script and naming objects. As Wickham and Grolemund (2017) explain here, it is also quite useful to come back to your script and to rewrite it to make it simpler and clearer.
An important step in this rewriting is to transform some of your code in functions. A good general rule is that if your are copying and pasting the same part of your code more than twice, it could be useful to transform it into a function. You will find useful content about how to program functions properly in Wickham (2019), beginning by the chapter on functions.9
If you have a set of functions that you are using regularly in one or several of your projects, you should consider writing a package. Even if you do not plan initially to share your code, writing a package is a good discipline for writing good code and for reproducibility. Later on, it would be useful for circulating your code and, perhaps, if you are satisfied with the result and think it could be useful to other R coders, you will want to publish it on CRAN. For writing a package, Wickham and Bryan (2021) offers an essential guide that you can also find online here. If you want to share your package, the pkgdown helps you to build easily a website documenting your package.
Writing and disseminating your work with R Mardown
Finally, you will probably need to circulate and publish your results. Fortunately, R Markdown is the perfect tool to do it. Outside of being able to run code within your R markdown document and thus to display the results, it offers many advantages like bibliographic management and Zotero integration.10 It allows you to build html, as well as pdf and word documents. For pdf, it relies on LaTeX and uses Pandoc for conversion from the markdown language.11 With R Markdown, you will be able to write (automatised) reports and dashboards, academic articles, books and thesis dissertation (Xie 2021, 2016), slides, and even build you own website (Xie, Dervieux, and Presmanes Hill 2021; Xie, Hill, and Thomas 2017) and applications (Chang et al. 2021; Wickham 2021b).
To learn to use R Markdown, you can refer to Xie, Allaire, and Grolemund (2018) and Riederer, Xie, and Dervieux (2021) with the corresponding website here and here.
References
Allaire, JJ, Yihui Xie, Jonathan McPherson, Javier Luraschi, Kevin Ushey, Aron Atkins, Hadley Wickham, Joe Cheng, Winston Chang, and Richard Iannone. 2021. Rmarkdown: Dynamic Documents for r. https://CRAN.R-project.org/package=rmarkdown.
Banks, George C., Haley M. Woznyj, Ryan S. Wesslen, and Roxanne L. Ross. 2018. “A Review of Best Practice Recommendations for Text Analysis in R (and a User-Friendly App).” Journal of Business and Psychology 33 (4): 445–59. https://doi.org/10.1007/s10869-017-9528-3.
Bryan, Jenny. 2017. STAT 545: Data Wrangling, Exploration, and Analysis with R.
Bryan, Jennyfer. 2019. Happy Git and GitHub for the useR.
Chang, Winston, Joe Cheng, JJ Allaire, Carson Sievert, Barret Schloerke, Yihui Xie, Jeff Allen, Jonathan McPherson, Alan Dipert, and Barbara Borges. 2021. Shiny: Web Application Framework for r. https://shiny.rstudio.com/.
Claveau, François, and Yves Gingras. 2016. “Macrodynamics of Economics: A Bibliometric History.” History of Political Economy, January.
Csardi, Gabor, and Tamas Nepusz. 2006. “The Igraph Software Package for Complex Network Research.” InterJournal Complex Systems: 1695. https://igraph.org.
Dowle, Matt, and Arun Srinivasan. 2021. Data.table: Extension of ‘Data.frame‘. https://CRAN.R-project.org/package=data.table.
Edwards, José, Yann Giraud, and Christophe Schinckus. 2018. “A Quantitative Turn in the Historiography of Economics?” Journal of Economic Methodology 25 (4): 283–90. https://doi.org/10.1080/1350178X.2018.1529133.
Goutsmedt, Aurélien, Alexandre Truc, and François Claveau. 2023. “biblionetwork: An R Package for Creating Different Types of Bibliometric Networks.” Zenodo. https://doi.org/10.5281/zenodo.7677369.
Greenwell, Bradley Boehmke & Brandon. 2020. Hands-On Machine Learning with R.
Grün, Bettina, and Kurt Hornik. 2011. “topicmodels: An R Package for Fitting Topic Models.” Journal of Statistical Software 40 (13): 1–30. https://doi.org/10.18637/jss.v040.i13.
———. 2021. Topicmodels: Topic Models. https://CRAN.R-project.org/package=topicmodels.
Healy, Kieran. 2018. Data Visualization: A Practical Introduction. Princeton, NJ: Princeton University Press.
Herfeld, Catherine, and Malte Doehne. 2019. “The Diffusion of Scientific Innovations: A Role Typology.” Studies in History and Philosophy of Science Part A 77 (October): 64–80. https://doi.org/10.1016/j.shpsa.2017.12.001.
McConville, Chester Ismay and Albert Y. Kim Foreword by Kelly S. 2021. Statistical Inference via Data Science.
Meyer, Fanny, and Victor Perrier. 2021. Esquisse: Explore and Visualize Your Data Interactively.
Ooms, Jeroen. 2021a. Pdftools: Text Extraction, Rendering and Converting of PDF Documents. https://CRAN.R-project.org/package=pdftools.
———. 2021b. Tesseract: Open Source OCR Engine.
Pedersen, Thomas Lin. 2020. Tidygraph: A Tidy API for Graph Manipulation. https://CRAN.R-project.org/package=tidygraph.
———. 2021. Ggraph: An Implementation of Grammar of Graphics for Graphs and Networks. https://CRAN.R-project.org/package=ggraph.
Riederer, Emily, Yihui Xie, and Christophe Dervieux. 2021. R Markdown Cookbook.
Roberts, Margaret, Brandon Stewart, and Dustin Tingley. 2020. Stm: Estimation of the Structural Topic Model. http://www.structuraltopicmodel.com/.
Robinson, David, and Julia Silge. 2020. Text Mining with R.
———. 2021. Tidytext: Text Mining Using Dplyr, Ggplot2, and Other Tidy Tools. https://github.com/juliasilge/tidytext.
Schmelzer, Alexander Gerber, Martin Arnold. 2021. Introduction to Econometrics with R.
Sievert, Carson. 2020. Interactive Web-Based Data Visualization with r, Plotly, and Shiny. Chapman; Hall/CRC. https://plotly-r.com.
Sievert, Carson, Chris Parmer, Toby Hocking, Scott Chamberlain, Karthik Ram, Marianne Corvellec, and Pedro Despouy. 2021. Plotly: Create Interactive Web Graphics via Plotly.js. https://CRAN.R-project.org/package=plotly.
Silge, Julia, and Emil Hvitfeldt. 2021. Supervised Machine Learning for Text Analysis in R.
Silge, Julia, and David Robinson. 2016. “Tidytext: Text Mining and Analysis Using Tidy Data Principles in r.” JOSS 1 (3). https://doi.org/10.21105/joss.00037.
Welbers, Kasper, Wouter Van Atteveldt, and Kenneth Benoit. 2017. “Text Analysis in R.” Communication Methods and Measures 11 (4): 245–65. https://doi.org/10.1080/19312458.2017.1387238.
Wickham, Hadley. 2016. Ggplot2: Elegant Graphics for Data Analysis. Springer-Verlag New York. https://ggplot2.tidyverse.org.
———. 2019. Advanced R, Second Edition. 2nd edition. Boca Raton: Chapman and Hall/CRC.
———. 2021a. Tidyverse: Easily Install and Load the Tidyverse. https://CRAN.R-project.org/package=tidyverse.
———. 2021b. Welcome | Mastering Shiny.
Wickham, Hadley, Mara Averick, Jennifer Bryan, Winston Chang, Lucy D’Agostino McGowan, Romain François, Garrett Grolemund, et al. 2019. “Welcome to the tidyverse.” Journal of Open Source Software 4 (43): 1686. https://doi.org/10.21105/joss.01686.
Wickham, Hadley, and Jennifer Bryan. 2021. Welcome! | R Packages.
Wickham, Hadley, Winston Chang, Lionel Henry, Thomas Lin Pedersen, Kohske Takahashi, Claus Wilke, Kara Woo, Hiroaki Yutani, and Dewey Dunnington. 2021. Ggplot2: Create Elegant Data Visualisations Using the Grammar of Graphics. https://CRAN.R-project.org/package=ggplot2.
Wickham, Hadley, and Garrett Grolemund. 2017. R for Data Science: Import, Tidy, Transform, Visualize, and Model Data. 1st edition. Sebastopol, CA: O’Reilly Media.
Xie, Yihui. 2016. Bookdown: Authoring Books and Technical Documents with R Markdown. Boca Raton, Florida: Chapman; Hall/CRC. https://bookdown.org/yihui/bookdown.
———. 2021. Bookdown: Authoring Books and Technical Documents with r Markdown. https://CRAN.R-project.org/package=bookdown.
Xie, Yihui, J. J. Allaire, and Garrett Grolemund. 2018. R Markdown: The Definitive Guide. Boca Raton, Florida: Chapman; Hall/CRC. https://bookdown.org/yihui/rmarkdown.
Xie, Yihui, Christophe Dervieux, and Alison Presmanes Hill. 2021. Blogdown: Create Blogs and Websites with r Markdown. https://CRAN.R-project.org/package=blogdown.
Xie, Yihui, Alison Presmanes Hill, and Amber Thomas. 2017. Blogdown: Creating Websites with R Markdown. Boca Raton, Florida: Chapman; Hall/CRC. https://bookdown.org/yihui/blogdown/.
For French-speaking readers, you can find an introduction to quantitative data and methods applied to history of economics, as well as several examples of the use of these methods here. ↩︎
I would not argue here about whether R or Python suits better for quantitative inquiries. My choice of R is totally path-dependent: I was working at the time on a collective project where some members of the project where programming in R. It was easier for me to follow their path and ask for their help. ↩︎
This website is produced notably thanks to blogdown R package (Xie, Dervieux, and Presmanes Hill 2021). ↩︎
Another major tool when you are dealing with very large set of data is the data.table package (Dowle and Srinivasan 2021), which increases dramatically programming speed. You can find many tutorials on data.table features on the package website. ↩︎
See for instance the github page of one project I am working on with Alexandre Truc. ↩︎
For examples of the use of bibliometrics in history of economics, see Claveau and Gingras (2016) or Herfeld and Doehne (2019). ↩︎
Collecting bibliometric data is not an easy task, as it depends on your access to different databases and to the types of information your are searching for. Besides, there is often a lot of cleaning to do on the data you have been able to download. I will try to do a blog post clarifying these issues soon. ↩︎
See Julia Silge’s blog for other examples of topic modelling in R—and for many other examples of modelling and prediction with R. ↩︎
If you are programming with dplyr, this vignette can also be useful. Same for data.table here. ↩︎
You can read this to see how Rstudio makes the interaction between R Mardown and Zotero easier. ↩︎
See this blog post for some advantages of writing in markdown and using pandoc rather than text editor like Word. ↩︎
Aurélien Goutsmedt
Post-Doctoral Researcher
My research interests include history of economics, economic expertise and bibliometrics.